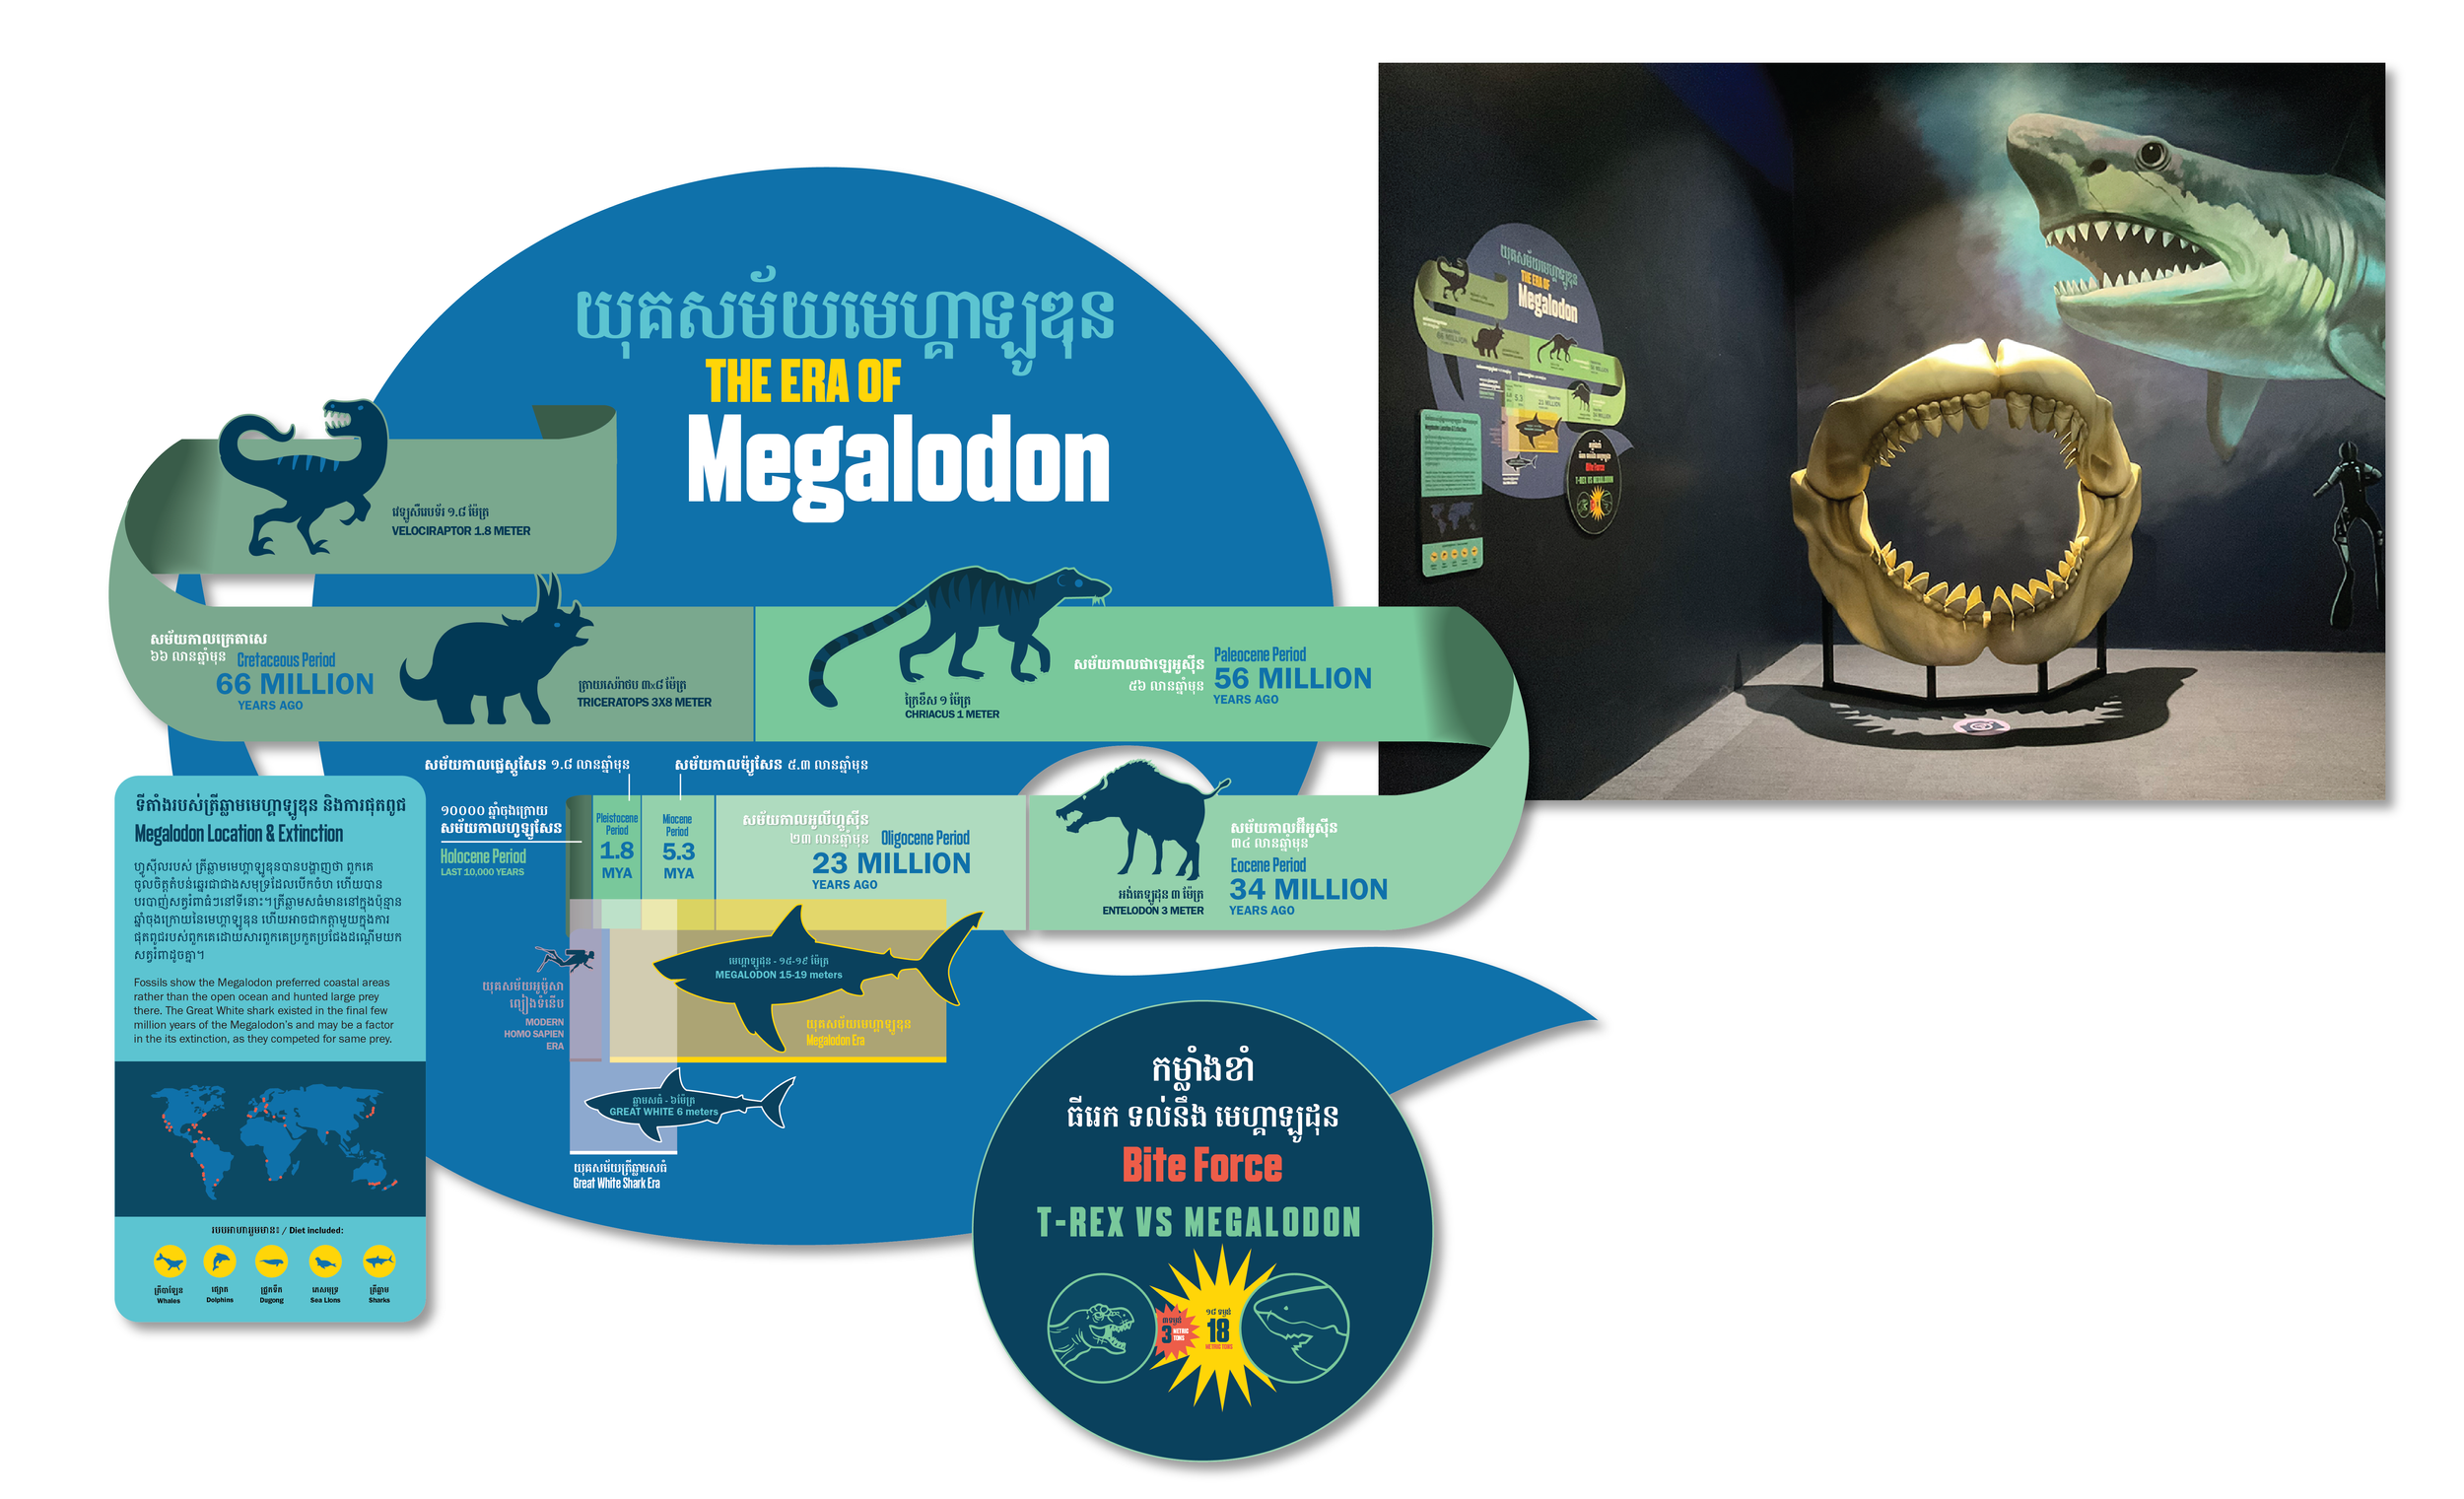
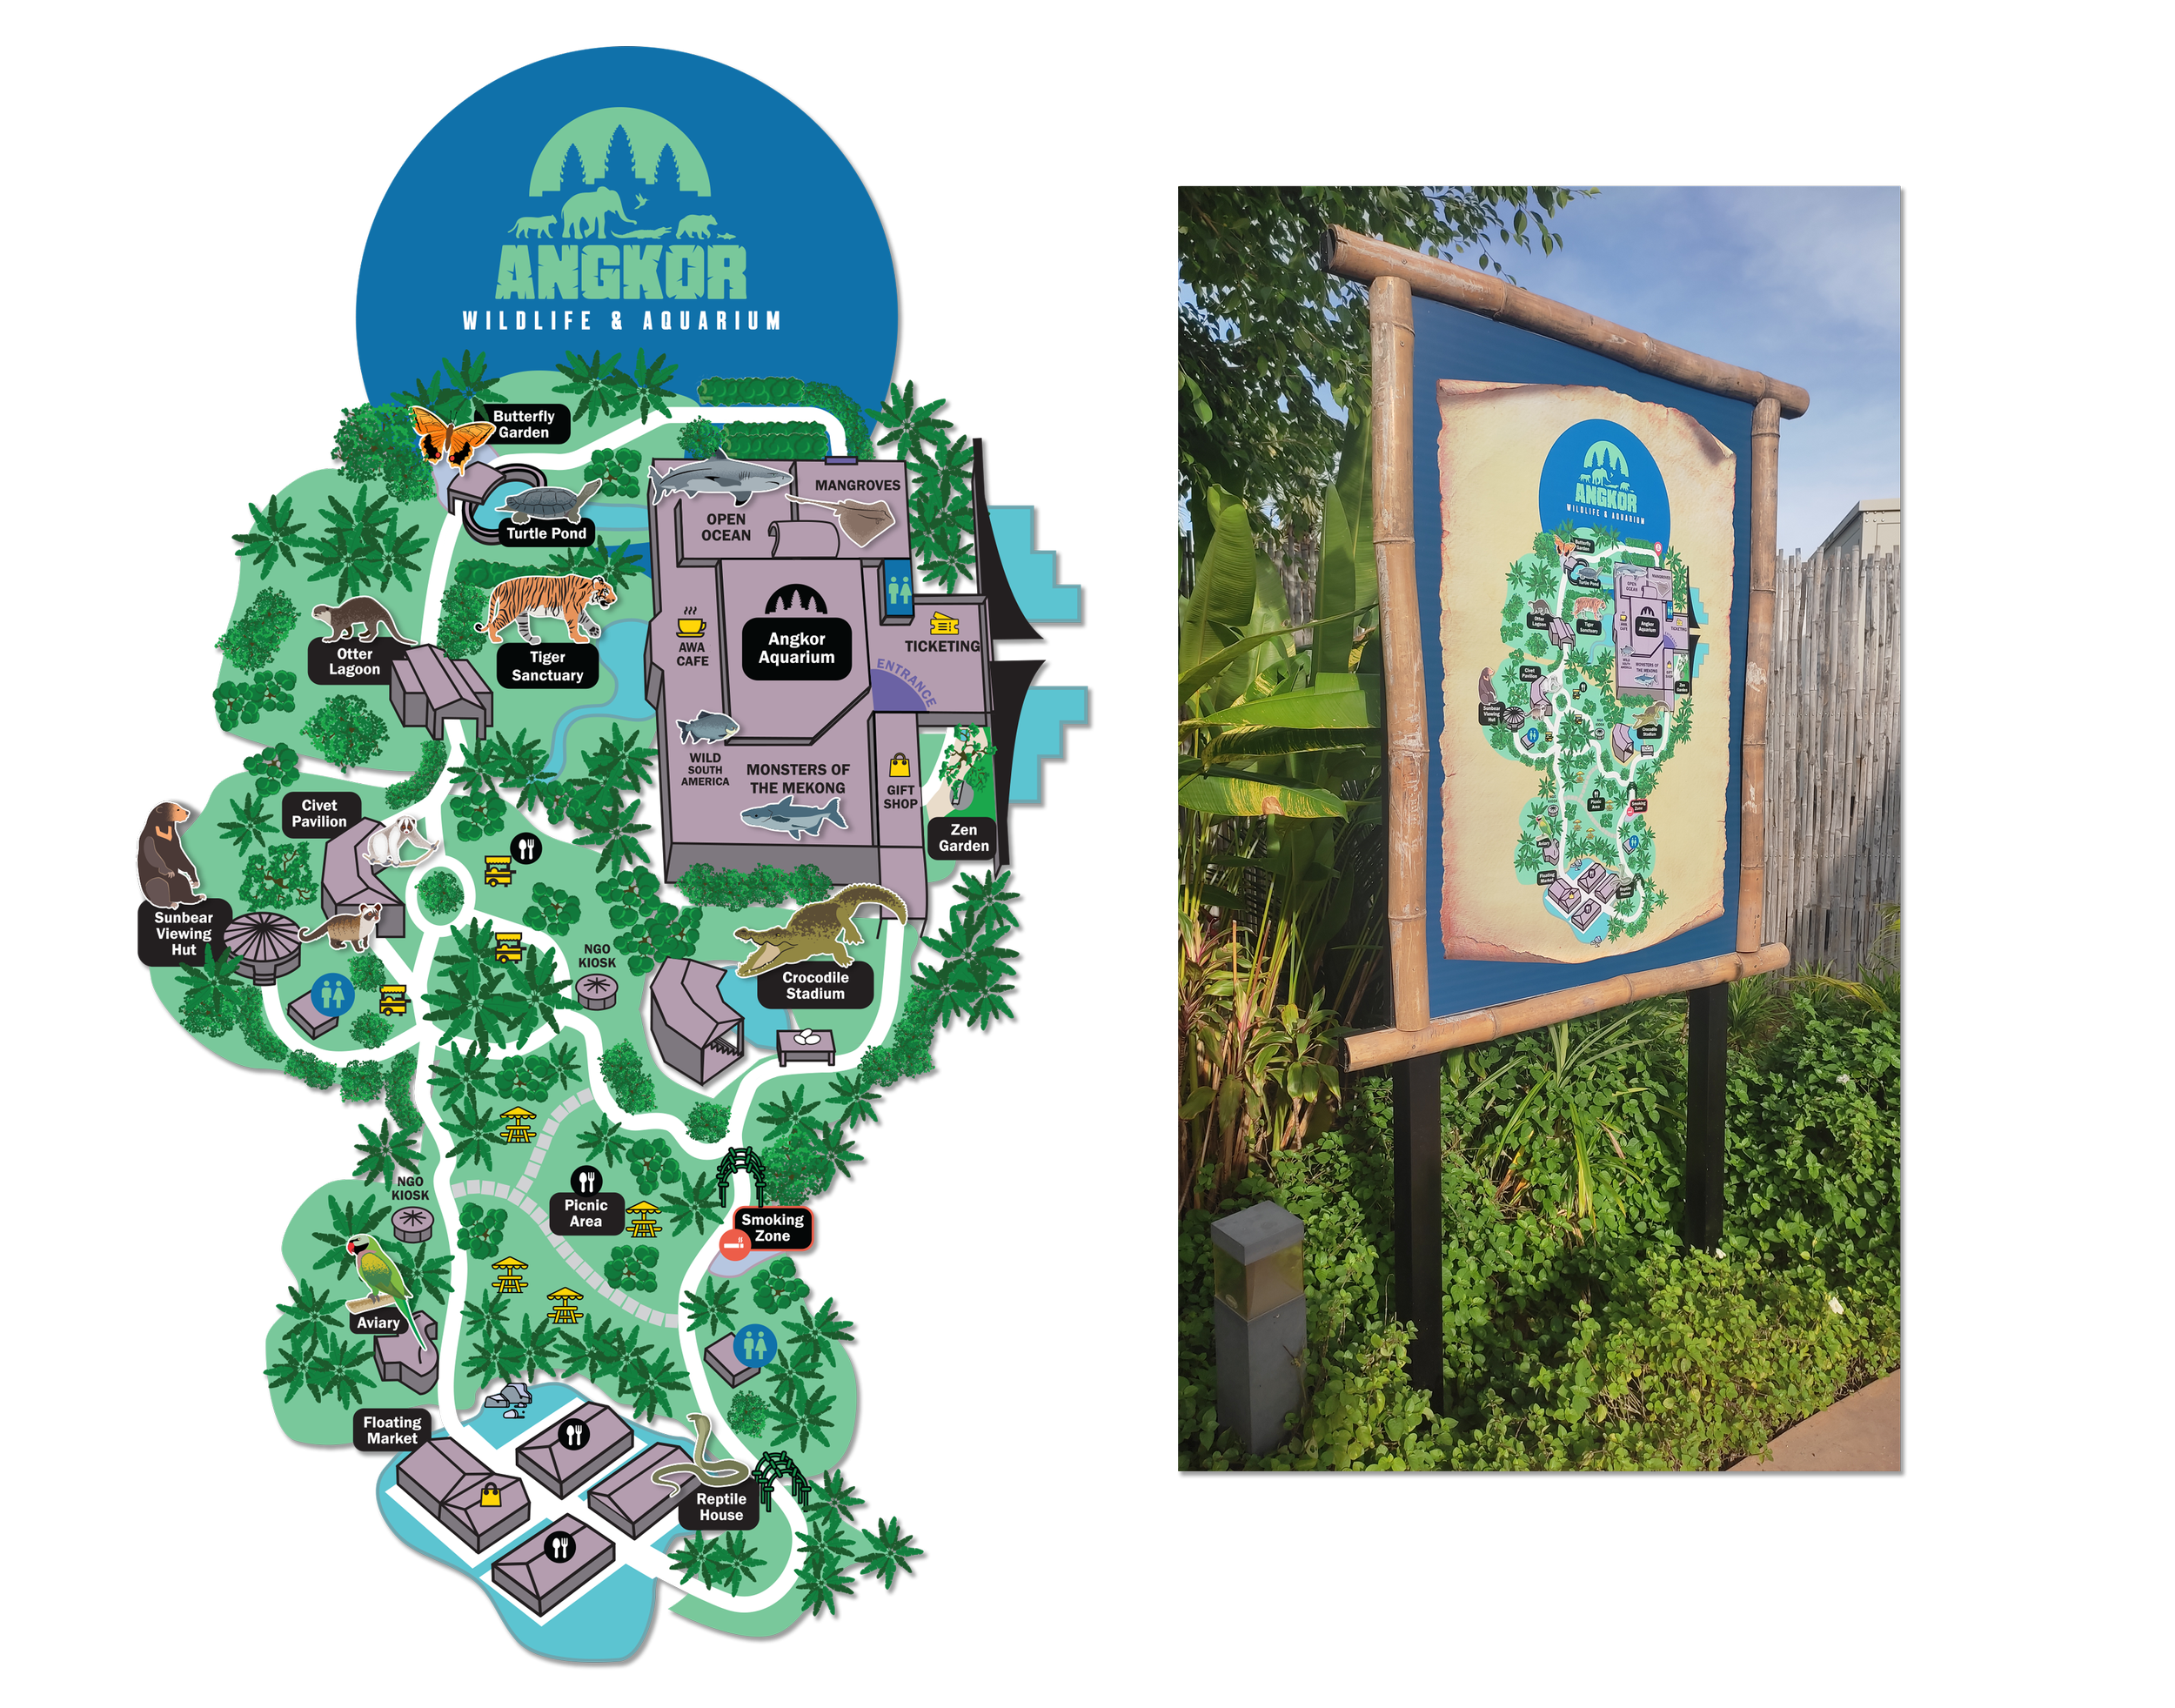
Visualizing your info and data.
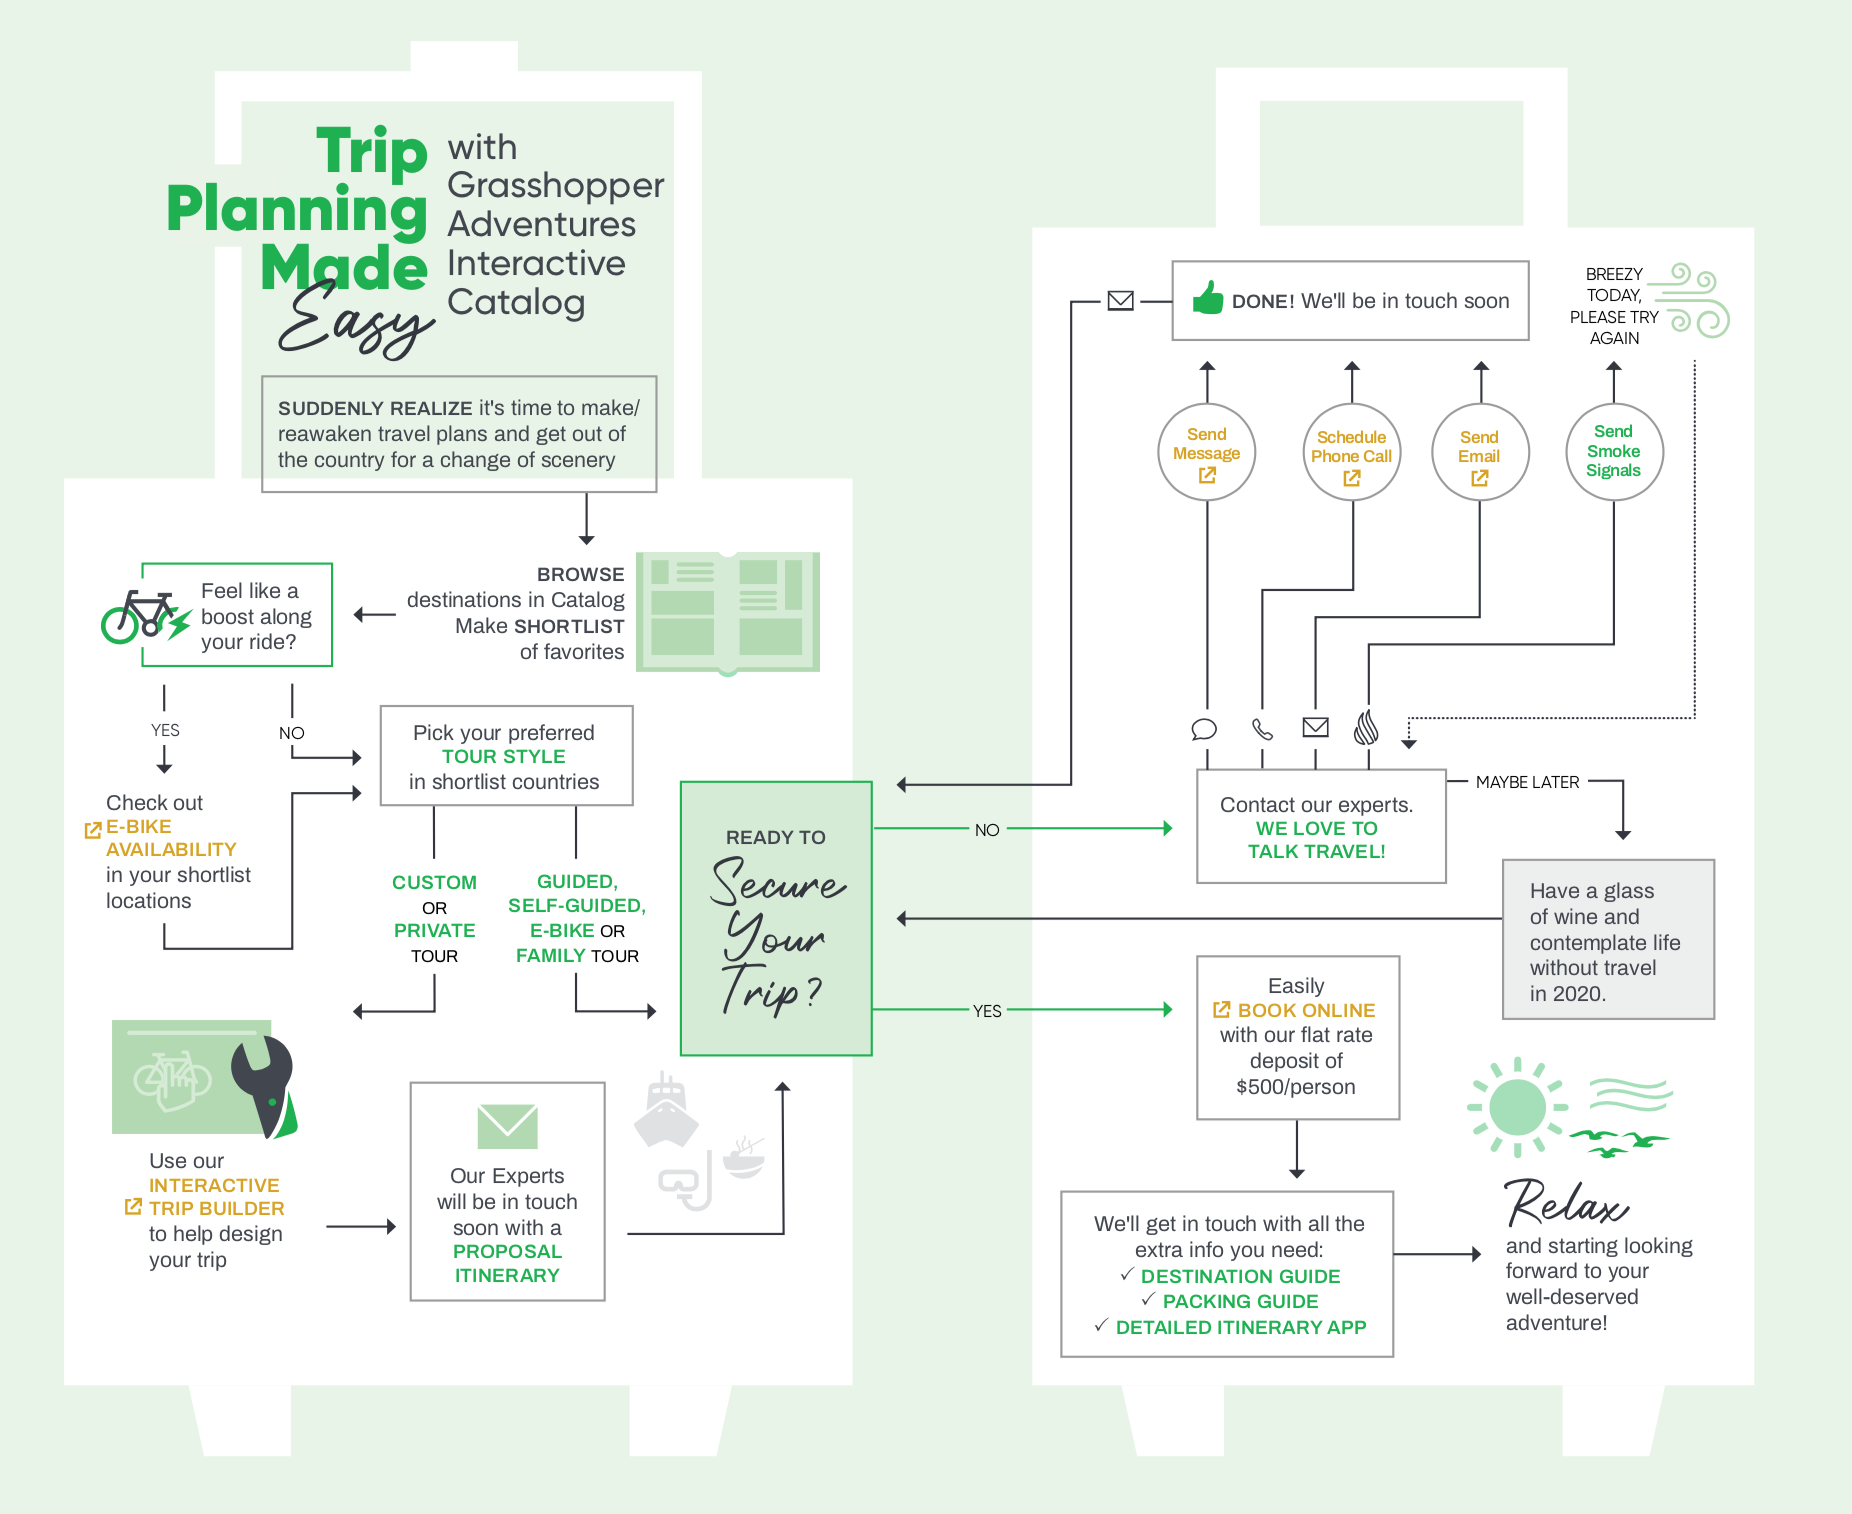
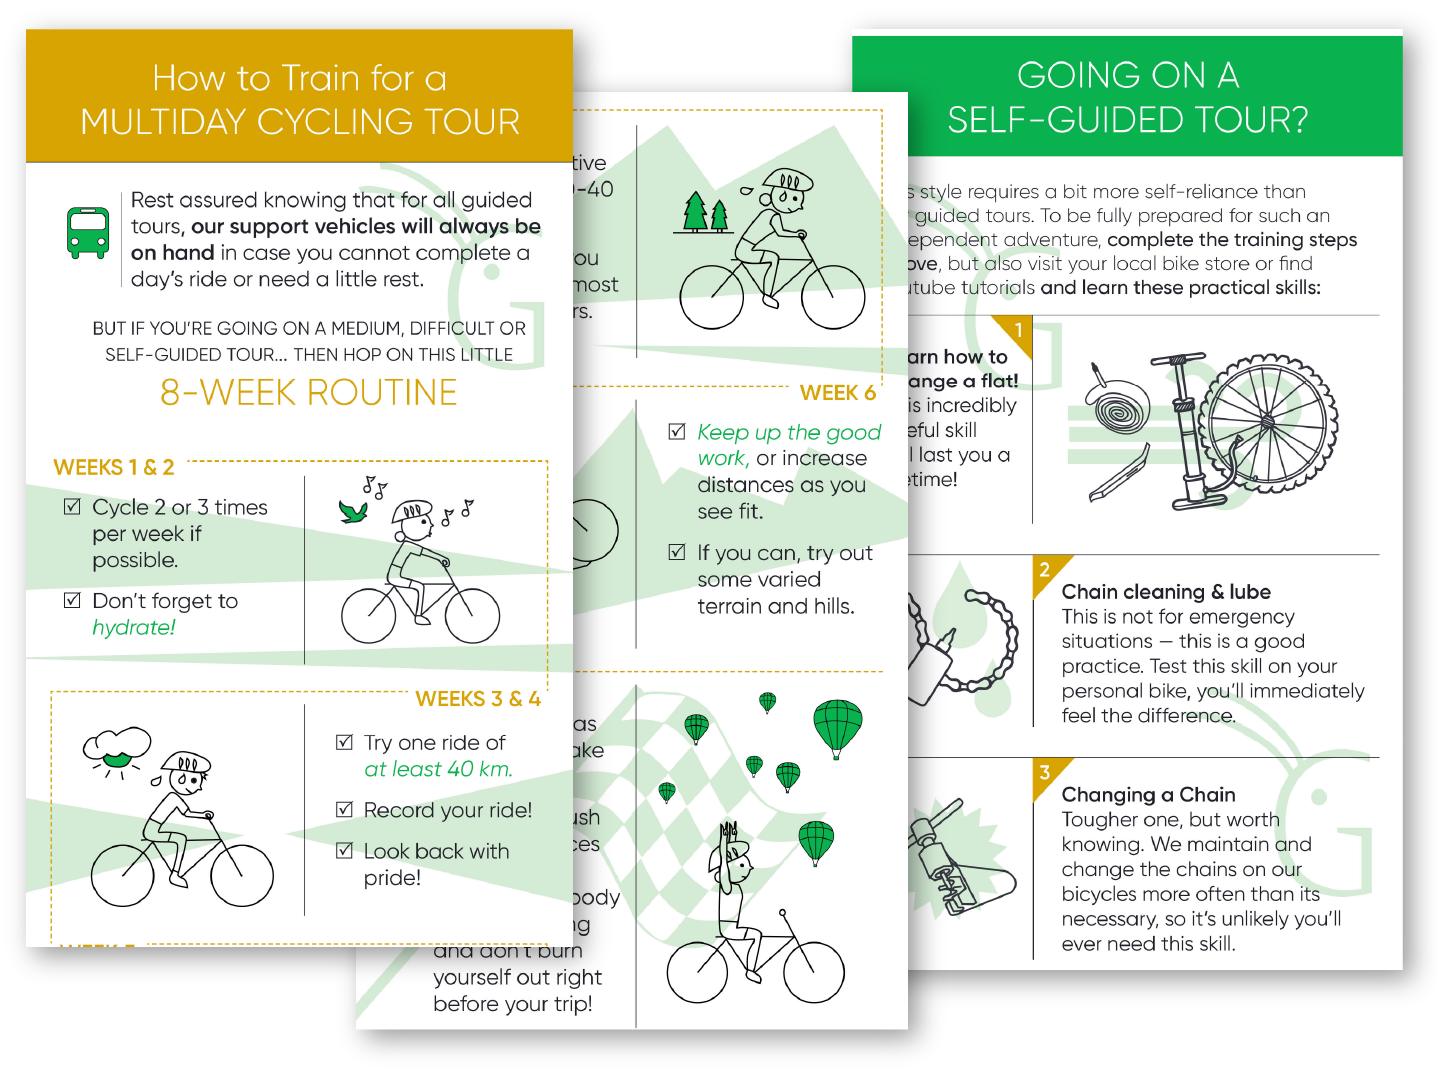
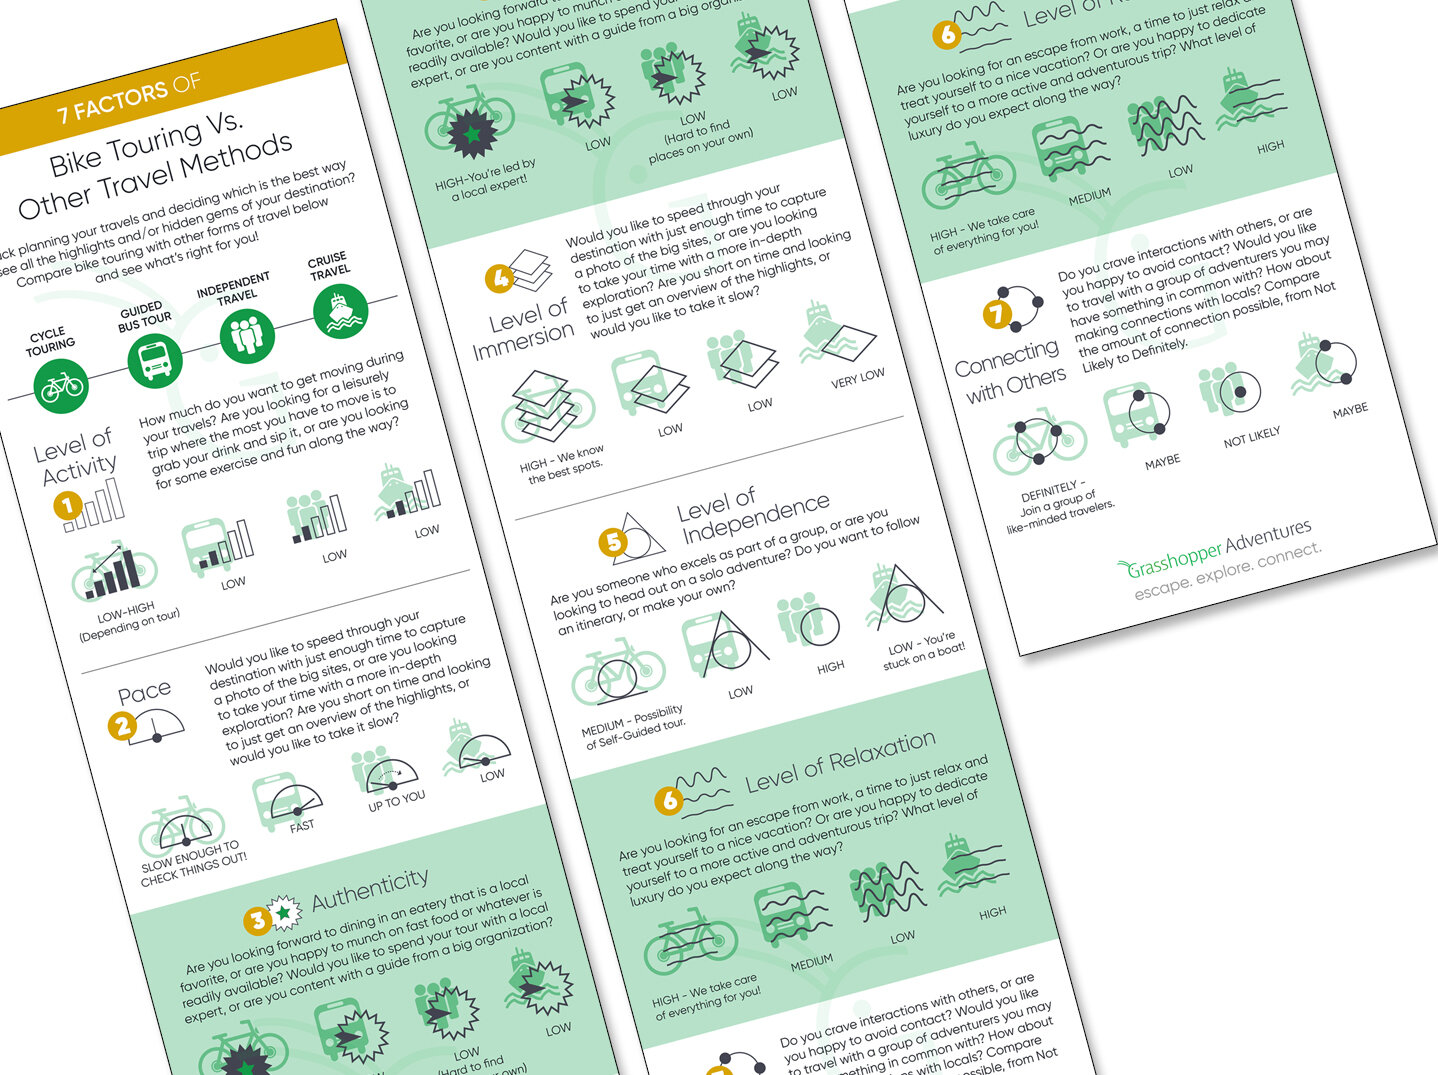
Infographic to compare cycling tours with other methods of travel, goal to reduce text and add a visual representation for each factor.